Agriculture zone maps are essential tools that help farmers, researchers, and policymakers understand the agricultural potential of specific regions. These maps visually represent different climatic, soil, and geographical conditions, which influence what types of crops can be grown and how farming practices should be adapted. They provide valuable insights into environmental factors that directly affect agricultural productivity, allowing for better planning and management.
What Is an Agriculture Zone Map?
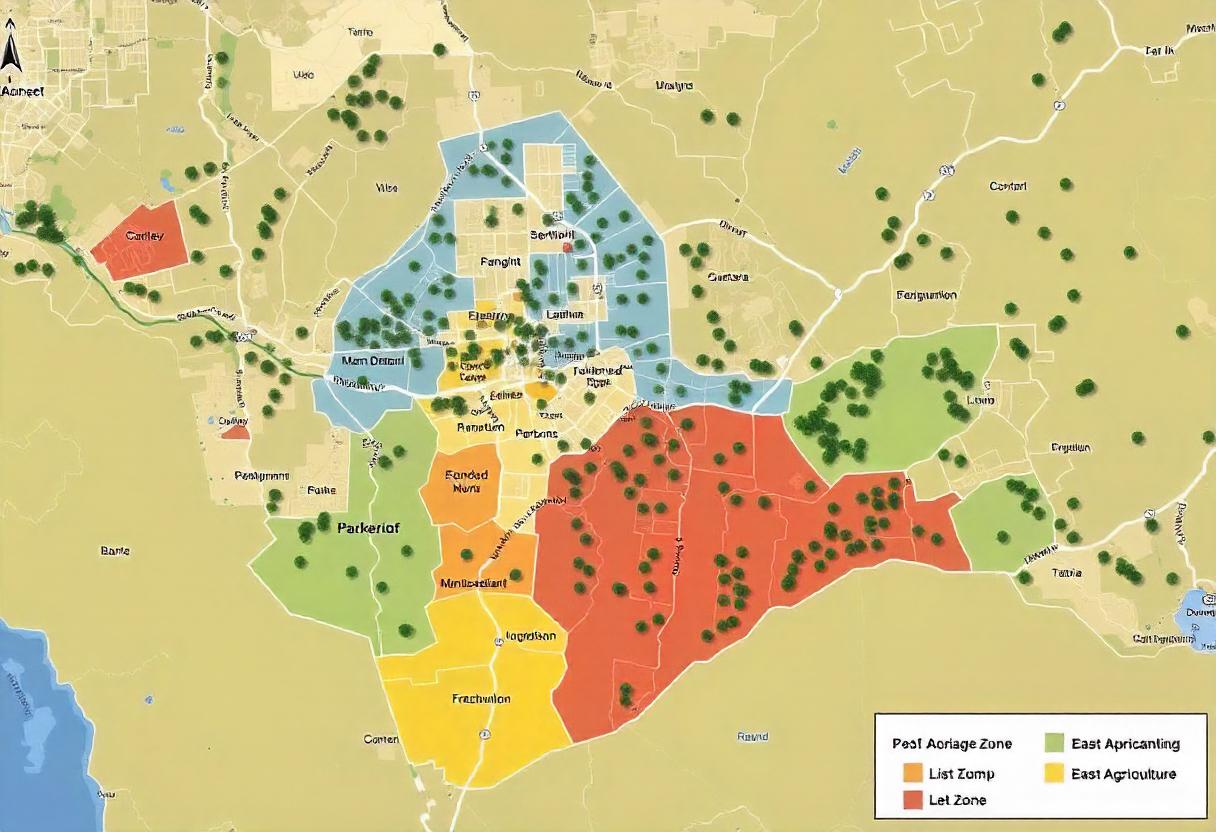
An agriculture zone map is a geographical representation that divides regions based on criteria such as temperature, rainfall, soil quality, and topography. These zones are used to guide farmers on which crops are most suited to their local environment. By analyzing various factors, agriculture zone maps help predict growing seasons, determine soil fertility, and identify water resources, enabling farmers to make more informed decisions.
Components of Agriculture Zone Maps
- Hardiness Zones: One of the most common elements in agriculture zone maps is the plant hardiness zone. Developed by agencies like the U.S. Department of Agriculture (USDA), these zones categorize areas based on their average minimum winter temperatures. Farmers and gardeners use hardiness zones to select crops and plants that can survive the winter cold in their region. For instance, crops suitable for USDA Zone 5 may not thrive in USDA Zone 9 due to significant differences in winter temperature.
- Rainfall and Precipitation Zones: Agriculture zone maps often include rainfall distribution data. This information is crucial for farmers to determine water availability for irrigation and understand the impact of precipitation on crop growth. Zones with high rainfall are more conducive to water-intensive crops like rice, while arid zones may require drought-resistant varieties.
- Soil Quality and Composition: Some agriculture zone maps take soil quality into account by categorizing regions based on their soil type, nutrient levels, and drainage capacity. This helps farmers understand the types of crops best suited to their soil conditions. For instance, clay-heavy soils may support crops like rice but may be less suitable for crops requiring well-drained soil, such as tomatoes.
- Temperature and Growing Seasons: Many agriculture zone maps highlight temperature variations and growing seasons. Warmer zones typically have longer growing seasons, enabling multiple harvests per year, while cooler zones have shorter seasons. These distinctions allow farmers to optimize planting and harvesting schedules.
- Topography and Elevation: Topography also plays a key role in agriculture zone maps. Elevation affects temperature and rainfall patterns, which in turn influence crop suitability. For example, crops grown in mountainous areas will often differ from those cultivated in low-lying regions due to differences in climate and soil depth.
Uses of Agriculture Zone Maps
- Crop Selection: Agriculture zone maps are widely used for selecting crops that are well-suited to a specific region’s climate and soil conditions. This ensures better crop performance and reduces the risk of crop failure due to unfavorable conditions. For example, a farmer in a semi-arid region may use the map to choose drought-tolerant crops like millet, rather than moisture-dependent crops like corn.
- Irrigation Planning: Maps showing rainfall distribution and water resources help in developing efficient irrigation systems. Farmers can plan water management strategies to ensure optimal crop growth while minimizing water waste.
- Climate Change Adaptation: As climate change alters traditional weather patterns, agriculture zone maps become increasingly important in helping farmers adapt. These maps can show how temperature and rainfall zones are shifting over time, allowing for adjustments in crop choices and farming methods.
- Pest and Disease Management: Agriculture zone maps can help predict areas at higher risk of pest infestations or crop diseases. Farmers can use this information to take preventive measures, such as rotating crops or using pest-resistant varieties.
- Policy and Planning: Governments and agricultural organizations use these maps for broader planning and policy-making. They guide decisions on where to invest in agricultural infrastructure, allocate resources, or focus research efforts to improve food security.
How Agriculture Zone Maps Are Created
Creating agriculture zone maps involves gathering extensive data from various sources. Climate data, soil surveys, and satellite imagery are combined with geographic information system (GIS) technology to create highly detailed maps. These maps can be updated regularly to reflect changes in climate or land use, ensuring that they remain relevant and useful for long-term agricultural planning.
By overlaying multiple layers of environmental data, agriculture zone maps provide a comprehensive understanding of a region’s agricultural potential.